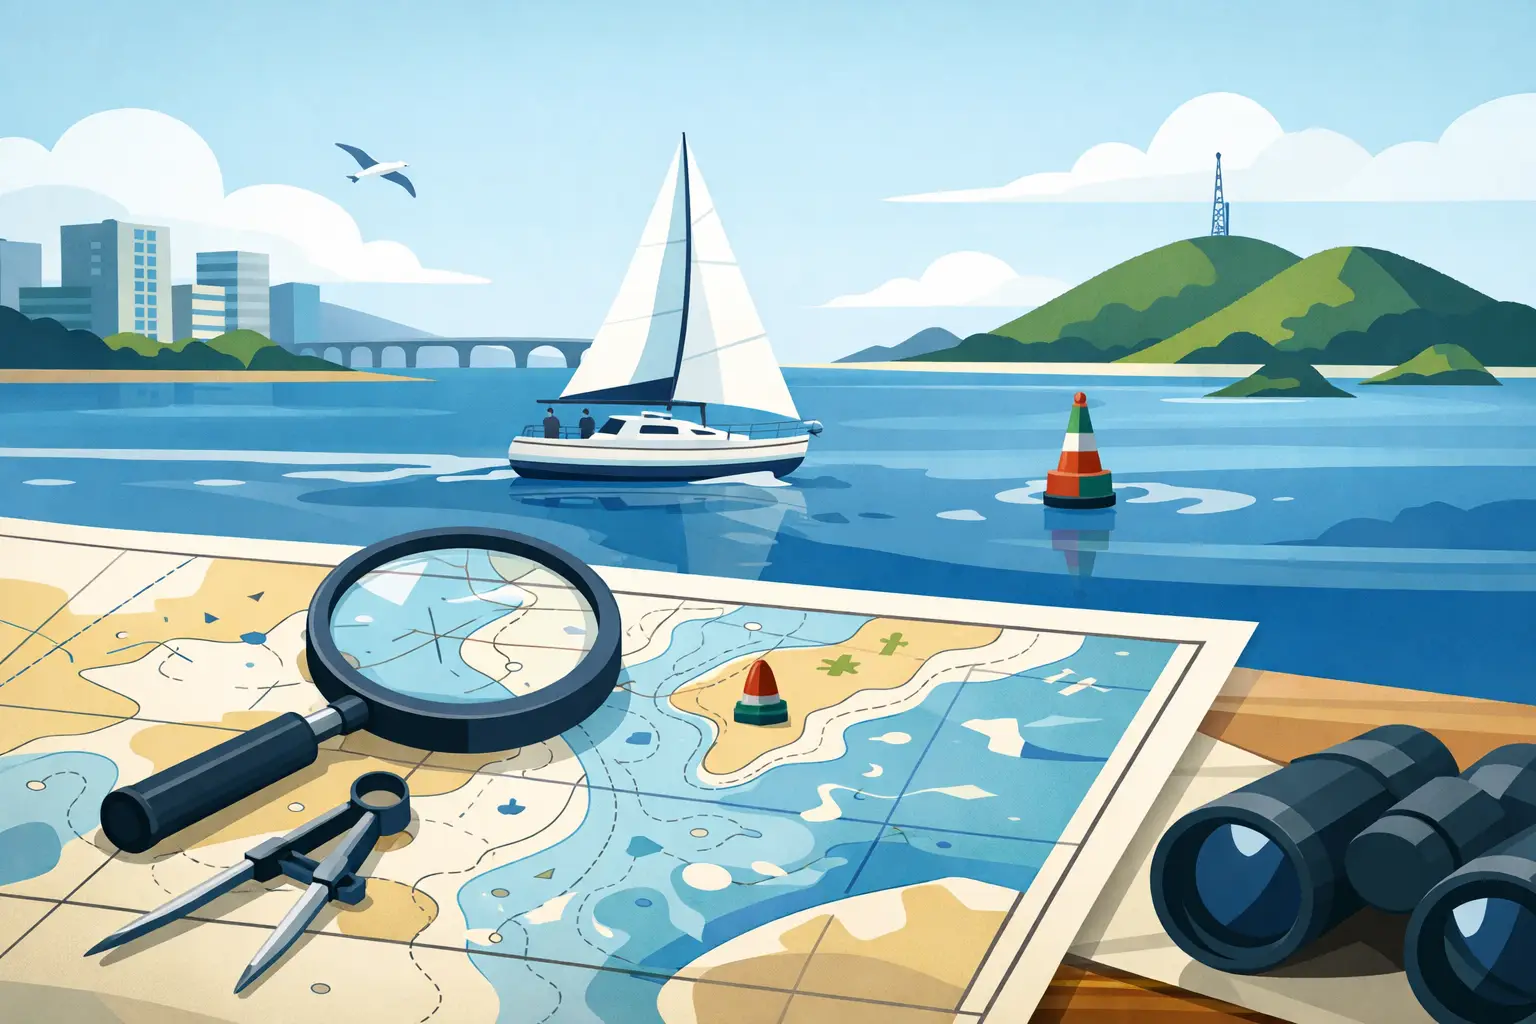
A windy afternoon on Lake Guaíba might be perfect for a nice boat ride, but the water that seems open ahead of the bow doesn't always leave much room for error. The Guaíba River nautical chart It is the tool that turns the landscape into practical information: it shows depths, channels, navigation aids, structures, and areas that require attention before casting off.
For beginners, it may seem like a jumble of numbers, symbols, and lines. In practice, it becomes easier to interpret when you connect each element to a real-world question on board: Is there enough water for my draft? What’s the safe course? What does that small light indicate? Where might a gust take me if I need to bear away?
What the nautical chart of the Guaíba River Shows
A nautical chart is not a tourist map. It is designed for navigation and uses specific reference points to help the navigator make decisions. On the Guaíba River, this is particularly important because the landscape combines large open areas, urban shorelines, islands, piers, marinas, dredged channels, boat traffic, and local variations in depth.
The first thing that usually catches people's attention is the polls, the numbers scattered across the chart. They indicate depths measured relative to a cartographic reference level, and not necessarily the water level you will encounter at that moment. If the chart shows 2.0 meters, for example, this value must be considered in relation to the current water level and the vessel’s draft.
A light sailboat with a short or retractable keel can handle a different margin of safety than a boat with a deeper, fixed keel. Even so, don’t treat a seemingly comfortable depth as a license to cut corners. Waves, the boat’s heel, positioning errors, and changes in the seabed reduce that margin of safety. Safe navigation relies on a margin of safety, not on the exact limit.
The chart also shows the coastline, islands, rocks, shoals, piers, ramps, bridges, cables, and other obstructions. Some hazards are visible above water; others are submerged and only appear to those who have consulted the chart. That is why simply looking at the shore or following another boat is not enough.
Depth, draft, and water level
Before planning a trip, start with three numbers: your boat’s draft, the shallowest depth expected along the route, and your desired safety margin. Draft is the deepest part of the vessel below the waterline, usually the keel. A sailboat with a draft of 1.50 meters requires much more planning than a dinghy or a shallow-draft one-design boat.
The depth shown on the chart is a hydrographic survey based on the datum indicated on it. The water level of Lake Guaíba can vary due to rain, wind, flow rates, and seasonal conditions. Therefore, the same area may present very different conditions on different days. Consult up-to-date water level data when planning an actual voyage and give preference to official, updated charts.
There is an important difference between sailing close to the shore for visual comfort and sailing along a safe channel. Near the shore, there may be shoals, rocks, debris from structures, and changes in the seabed. In some situations, the marked channel is the most predictable option, but it also requires extra attention to traffic and right-of-way rules.
If you’re still learning, try a simple exercise before you take off: choose a short route between two familiar points and mentally note where you wouldn’t want to be in the event of strong winds, low visibility, or an auxiliary engine failure. This proactive assessment improves your decision-making when things get hectic.
Understanding Bearing, Scale, and Position
A nautical chart includes a compass rose, lines of latitude and longitude, and a scale. The compass rose helps you relate your geographic direction to the course you intend to follow. The scale, on the other hand, indicates the level of detail: a chart covering a larger area is good for general planning; a detailed chart is more suitable for entering channels, marinas, and approaching the shore.
Do not use a low-scale chart to navigate a narrow passage. It may oversimplify essential details or fail to show minor obstacles. When navigating near structures and in shallow areas, use the most detailed chart available.
When setting a course, don't think of it as a line that must be followed strictly. On a sailboat, the wind determines whether you can sail directly to your destination. If your destination is upwind, it will be required point up, alternating sides. The chart shows the physical limits of this strategy: how far you can sail upwind without getting too close to a shallow area, an island, a busy channel, or a leeward shore.
This is one of the most valuable strategies for racing and training. You don’t just choose the fastest tack. You choose the tack that gives you room to maneuver, takes hazards into account, and keeps your options open in case the wind shifts or a gust picks up.
Wayfinding: the signs that guide your route
Buoys, beacons, and other navigational aids are shown on the chart with their own symbols and characteristics. They may indicate channel boundaries, isolated hazards, changes in direction, or reference points for positioning. On the water, also note the color, shape, and numbering, and at night, the type of light, when applicable.
Trying to memorize all the symbols at once isn't the best approach. Start by understanding the system in the area where you’re navigating and compare the chart with what you see. Do this at a safe speed. A buoy isn’t just an object to navigate around—it confirms that your estimated position makes sense and reveals where the navigable route may change.
In commercial traffic areas, do not turn the channel into a practice course. Larger vessels have limited maneuverability and may be at risk in the channel. Stay alert, follow navigation rules, and choose a route that does not pose a risk to anyone.
Use the wind chart to gauge the wind before the start
The chart doesn't show the gust that's coming in the next few minutes, but it helps predict how the terrain and the geometry of the shoreline will affect sailing conditions. Islands, headlands, buildings, marinas, and narrow channels can create wind shadows, acceleration, eddies, and choppier water.
Imagine a wind blowing in from the southwest. A shore or island on the windward side can reduce the wind in its shadow, while a narrower channel can accelerate it. This doesn’t eliminate the need to observe the water, the flag, and the clouds. It simply provides context for interpreting what the boat is experiencing.
In a regatta, the chart also helps you identify the side of the course that offers the most freedom to maneuver. Perhaps the port side seems more promising in terms of the wind, but it might take you into shallow water or a traffic zone. It might be better to sacrifice a few meters at the start to gain a clean finish at the buoy. A good strategy isn't just about speed: it's about speed with space and safety.
In VelejAÍ, it's worth repeating this line of reasoning in the simulator. Adjust the sails, observe the apparent wind, tack, and see how a decision about your course changes your options. Then, apply that logic to chart reading and planning an actual sail.
A practical checklist before you head out
Preparation works best when it is brief and repeatable. Before setting out, check four things: the appropriate chart for the area, the depths and water level, any notices or changes relevant to navigation, and the wind and weather forecast. Next, establish a primary route and at least one simple alternative route for returning or seeking shelter.
On the boat, keep the chart handy, even if you’re using GPS or an app. Electronic devices make navigation much easier, but they are no substitute for critical judgment. Batteries run out, screens can malfunction, the signal can fluctuate, and an automatic route doesn’t account for your experience, your draft, or conditions that have changed since the last update.
While sailing, continually compare your planned course with your actual position. Is the buoy where it’s supposed to be? Does the shore match the chart? Does the measured depth make sense? Is the wind pushing the boat toward an area you wanted to avoid? This constant checking is what separates following a line on the screen from actually sailing.
An updated chart does not replace on-board monitoring
Official and up-to-date charts are the foundation for planning, but no publication can replace active lookout, appropriate speed, and good judgment. The seabed may change, a temporary structure may appear, a buoy may be out of position, and visibility can drop rapidly. If you have any doubts about depth or the passage, slow down, move away from the hazard, and reassess.
Learning to read the nautical chart of the Guaíba River means learning to ask better questions before setting a course. Set out with curiosity, but sail with caution: every number, symbol, and channel correctly interpreted opens up the possibility to sail more freely, trim the sails with confidence, and make the most of the wind without leaving decisions to chance.